
Browse docs
Read your dashboard
What every part of the Dashboard shows, from the Today strip and Outreach journey to channels, campaign rankings, sending seats and the reporting period.
Updated
On this page
The Dashboard is the first page you see after signing in. It answers two questions: how is outreach performing, and what needs you today. This guide walks through the page from top to bottom and explains what each figure counts. The right-hand column (Needs you now, Leads in sequence, Latest replies and Live activity) has its own guide: Needs you now and activity.
How it works
- Your campaigns send connection requests, messages and emails from your seats, and leads accept, open and reply.
- ReacherPro counts all of it, for every campaign and seat in your workspace.
- The Dashboard shows those counts for the reporting period you pick at the top of the page. Every card follows the same period, so the whole page always describes the same days.
- Cards on the right point you at what to do next: a seat to reconnect, a reply to answer, a lead to check.
Before you start: The Dashboard fills up once outreach is running. You need:
- a connected LinkedIn seat or email inbox (Connect a LinkedIn account, Connect an email inbox)
- a lead list (Create a lead list)
- a launched campaign (Build and launch a campaign)
Until then, each card shows a short message such as Nothing went out in this period.
Open the dashboard
- In the sidebar, under Overview, click Dashboard. The page opens with a greeting, Welcome, Maya (with your own first name).
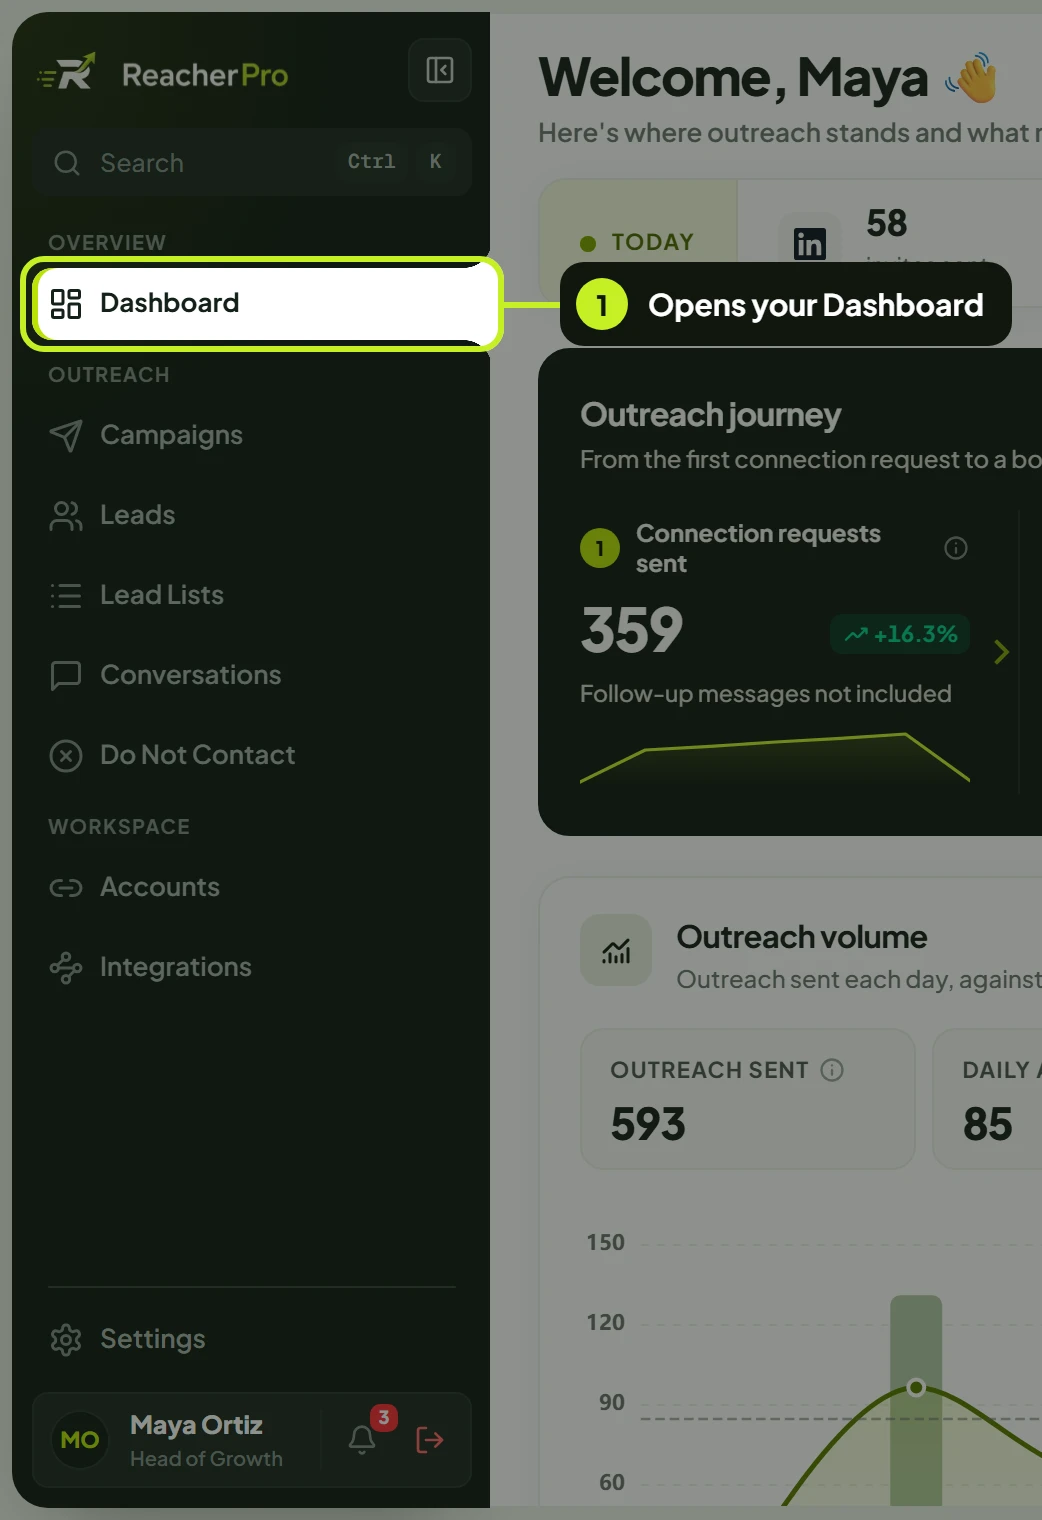
The layout, top to bottom:
| Part | What it tells you |
|---|---|
| Today strip | What went out today, and how many senders are active |
| New campaign and the reporting period | A shortcut to start a campaign; which days the page covers |
| Outreach journey | The five headline results, from connection request to meeting |
| Outreach volume | How much went out each day, against the replies that came back |
| What went out | Every campaign action each day, by step type |
| Channels | How LinkedIn and email are converting |
| Campaigns | Your campaigns ranked by the result you choose |
| Sending seats | Results by the LinkedIn account or inbox that sent them |
| Right-hand column | What needs you now, and the latest replies and activity |
The header: Today strip, New campaign and reporting period
- Read the Today strip under the greeting. It always shows today, whatever period you pick: invites sent, emails sent, active seats (LinkedIn accounts sending today) and active mailboxes (email inboxes sending today).
- To start a campaign from here, click New campaign in the top right. It opens What do you want to send?, the same chooser as on the Campaigns page. You only see this button if your role can create campaigns.
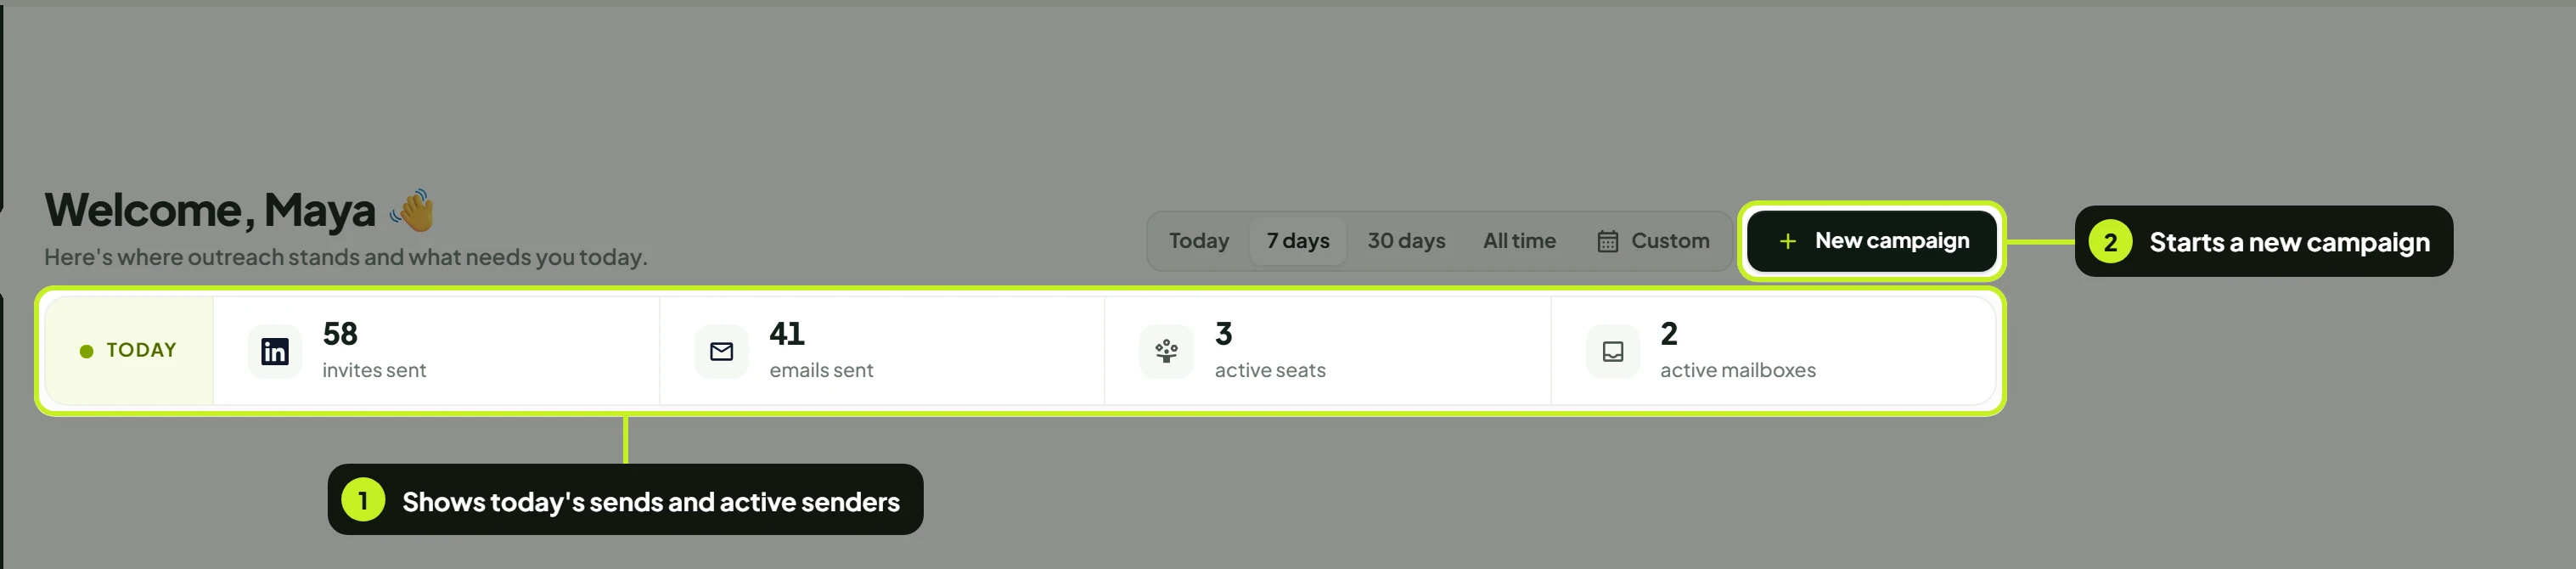
- Pick a reporting period with the tabs next to New campaign: Today, 7 days, 30 days or All time. The page opens on 7 days. Every card below updates to the new period.
- For any other range, click Custom and pick a start date and an end date on the calendar. The calendar closes once both are picked, and the tab shows the range you chose. To go back to the usual view, open Custom again and click Clear: the page returns to 7 days.
Note: Changing the period sends the list cards (Campaigns, Sending seats and the right-hand column) back to their first page.
Outreach journey
The dark band shows your five headline results as one path, read left to right: how many requests went out, how many were accepted, who replied, who was interested and who booked.
- Read each stage: the number, a chip with the change, a short note on what it counts and a small line showing the trend day by day.
- Check what the change is measured against. The label in the top right of the band says so, for example vs previous 7 days (or vs yesterday, vs previous 30 days, or the length of your custom range).
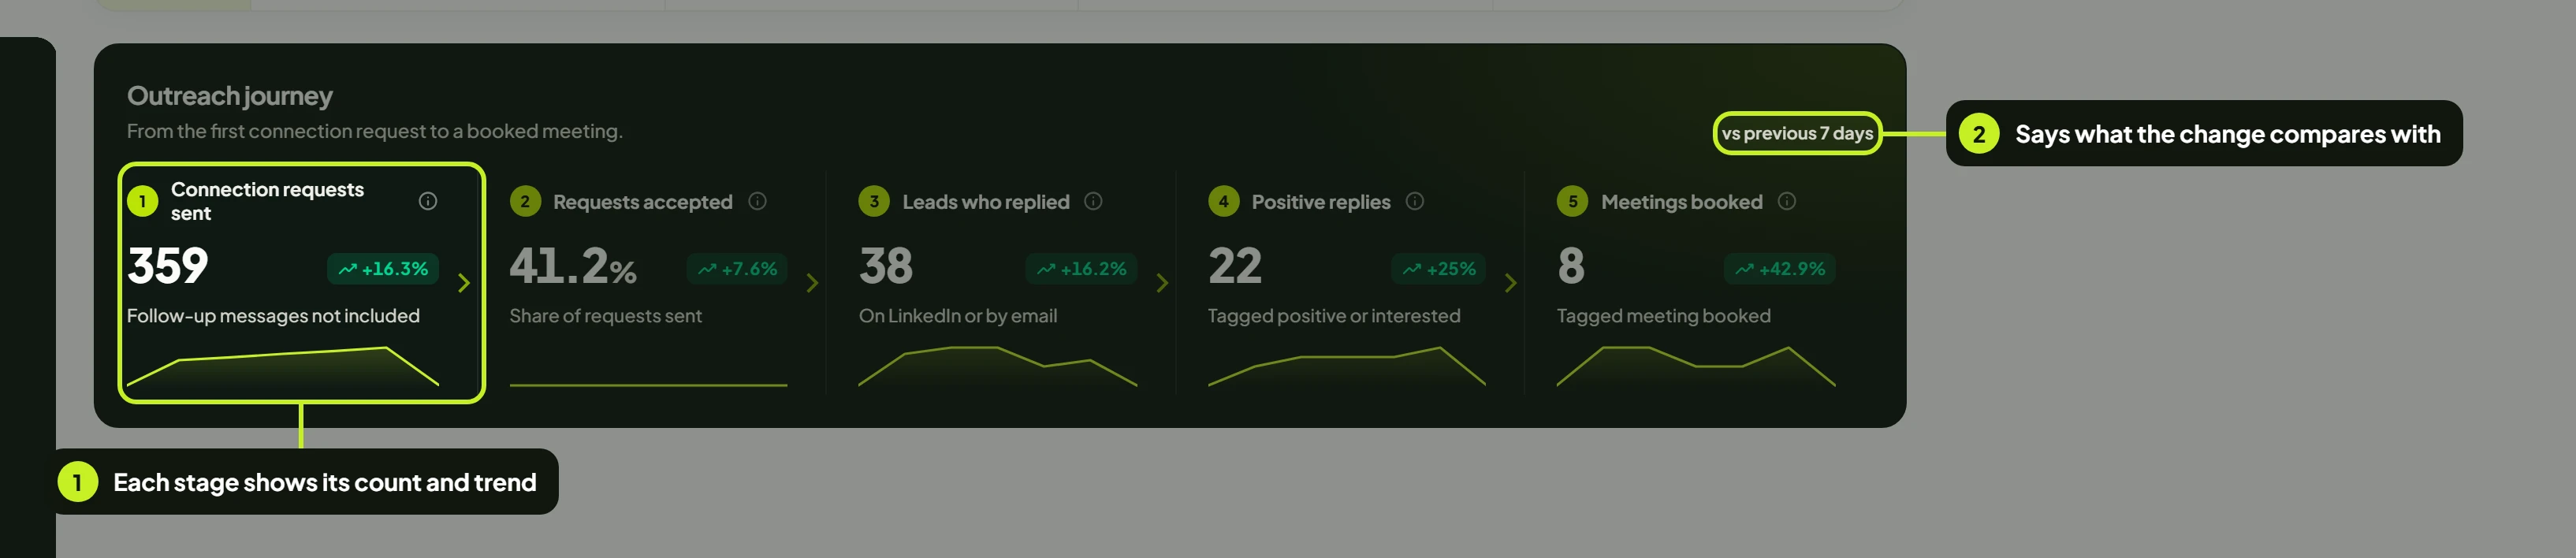
| Stage | What it counts |
|---|---|
| Connection requests sent | Connection requests that went out in the period. Follow-up messages are counted separately, because they can't be accepted. |
| Requests accepted | Accepted requests, as a share of the requests sent in the period. |
| Leads who replied | Leads who wrote back in the period, on LinkedIn or by email. |
| Positive replies | Leads your campaigns tagged positive replied or interested in the period. Tags you add by hand show on Latest replies, not here. |
| Meetings booked | Leads your campaigns tagged meeting booked in the period. |
The change chip is green with a + when the figure went up, red when it went down, No change when it's the same, and New when there was nothing in the previous period to compare with. All time has no previous period, so it shows no chips. Hover the ⓘ next to a stage name to read its definition.
Outreach volume
This card shows whether your volume is paying off: what went out each day, against the replies that came back.
- Read the four totals for the period: Outreach sent, Daily average sent, Replies received and Reply rate.
- Read the chart: each bar is the outreach sent that day (left axis), the green line is the replies received that day (right axis, in green), and the dashed line marks your Daily average. Hover a day to see its exact figures.
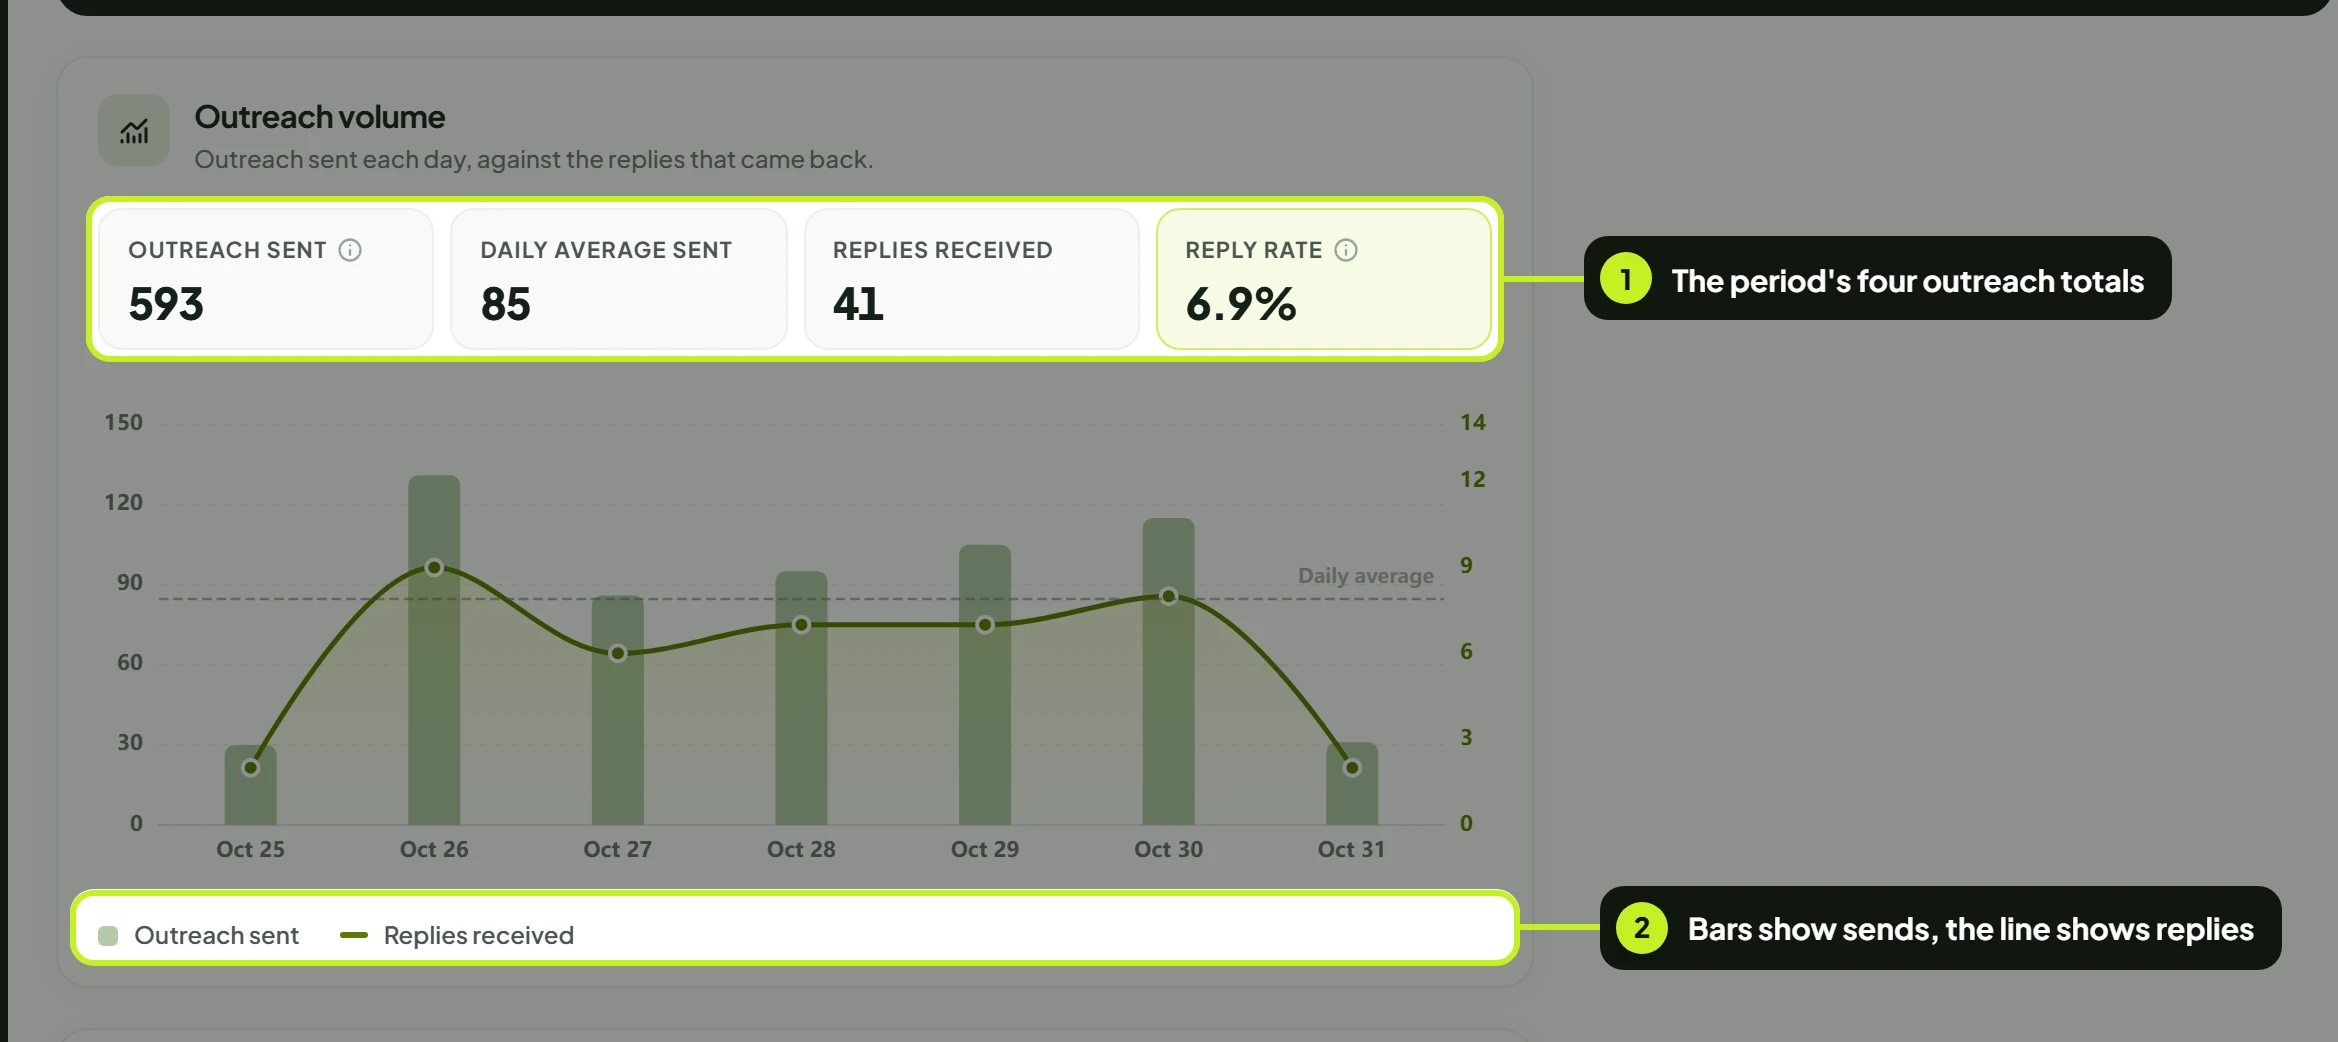
- Outreach sent counts connection requests, follow-up messages, InMails and emails. Profile visits, likes and follows aren't counted here; they're in What went out.
- Reply rate is replies received as a share of the outreach sent in the period.
Replies have their own axis because they're a fraction of the volume. Read the line's shape, not its height against the bars.
What went out
This card answers sent what?: every action your campaigns ran each day, stacked by step type.
- Read the key under the chart. It lists each step type that ran in the period with its total, in the same colour as its band in the bars.
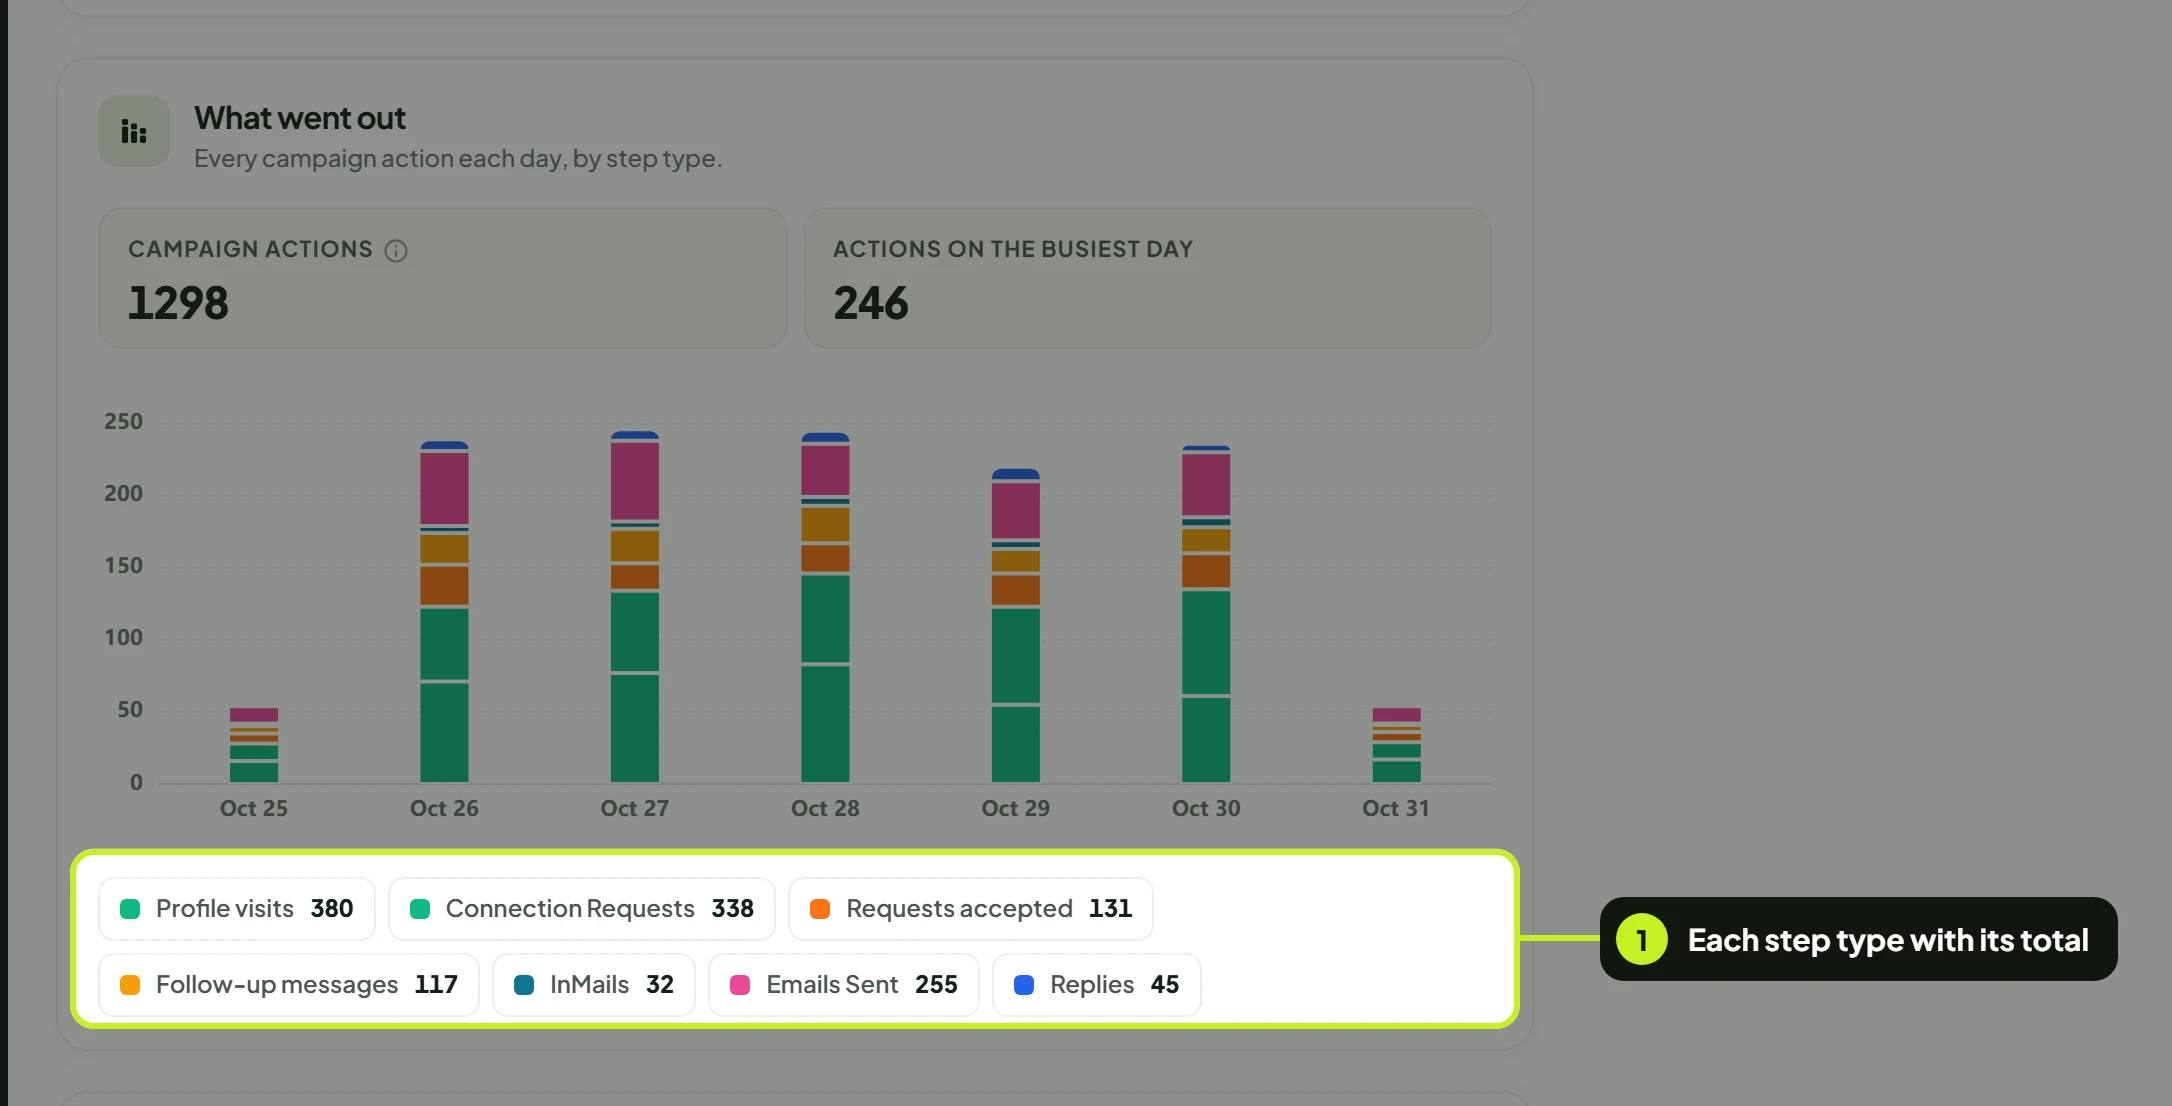
The totals at the top are Campaign actions (every step your campaigns ran, including profile visits, likes, comments and follows) and Actions on the busiest day. Step types include Leads started, Profile visits, Posts liked, Comments posted, Profiles followed, Companies followed, Connection requests, Follow-up messages, InMails, Emails, Requests withdrawn, Requests accepted and Replies. A step type that did nothing in the period is left out of the key.
Channels
Each channel is judged by the rate that matters for it, so the cards don't share one yardstick.
- On the LinkedIn card, read Invite accept rate: connection requests accepted, as a share of the requests sent on LinkedIn.
- On the Email card, read Email open rate (emails opened, as a share of emails sent) and Click rate (how often a link in your emails was clicked).
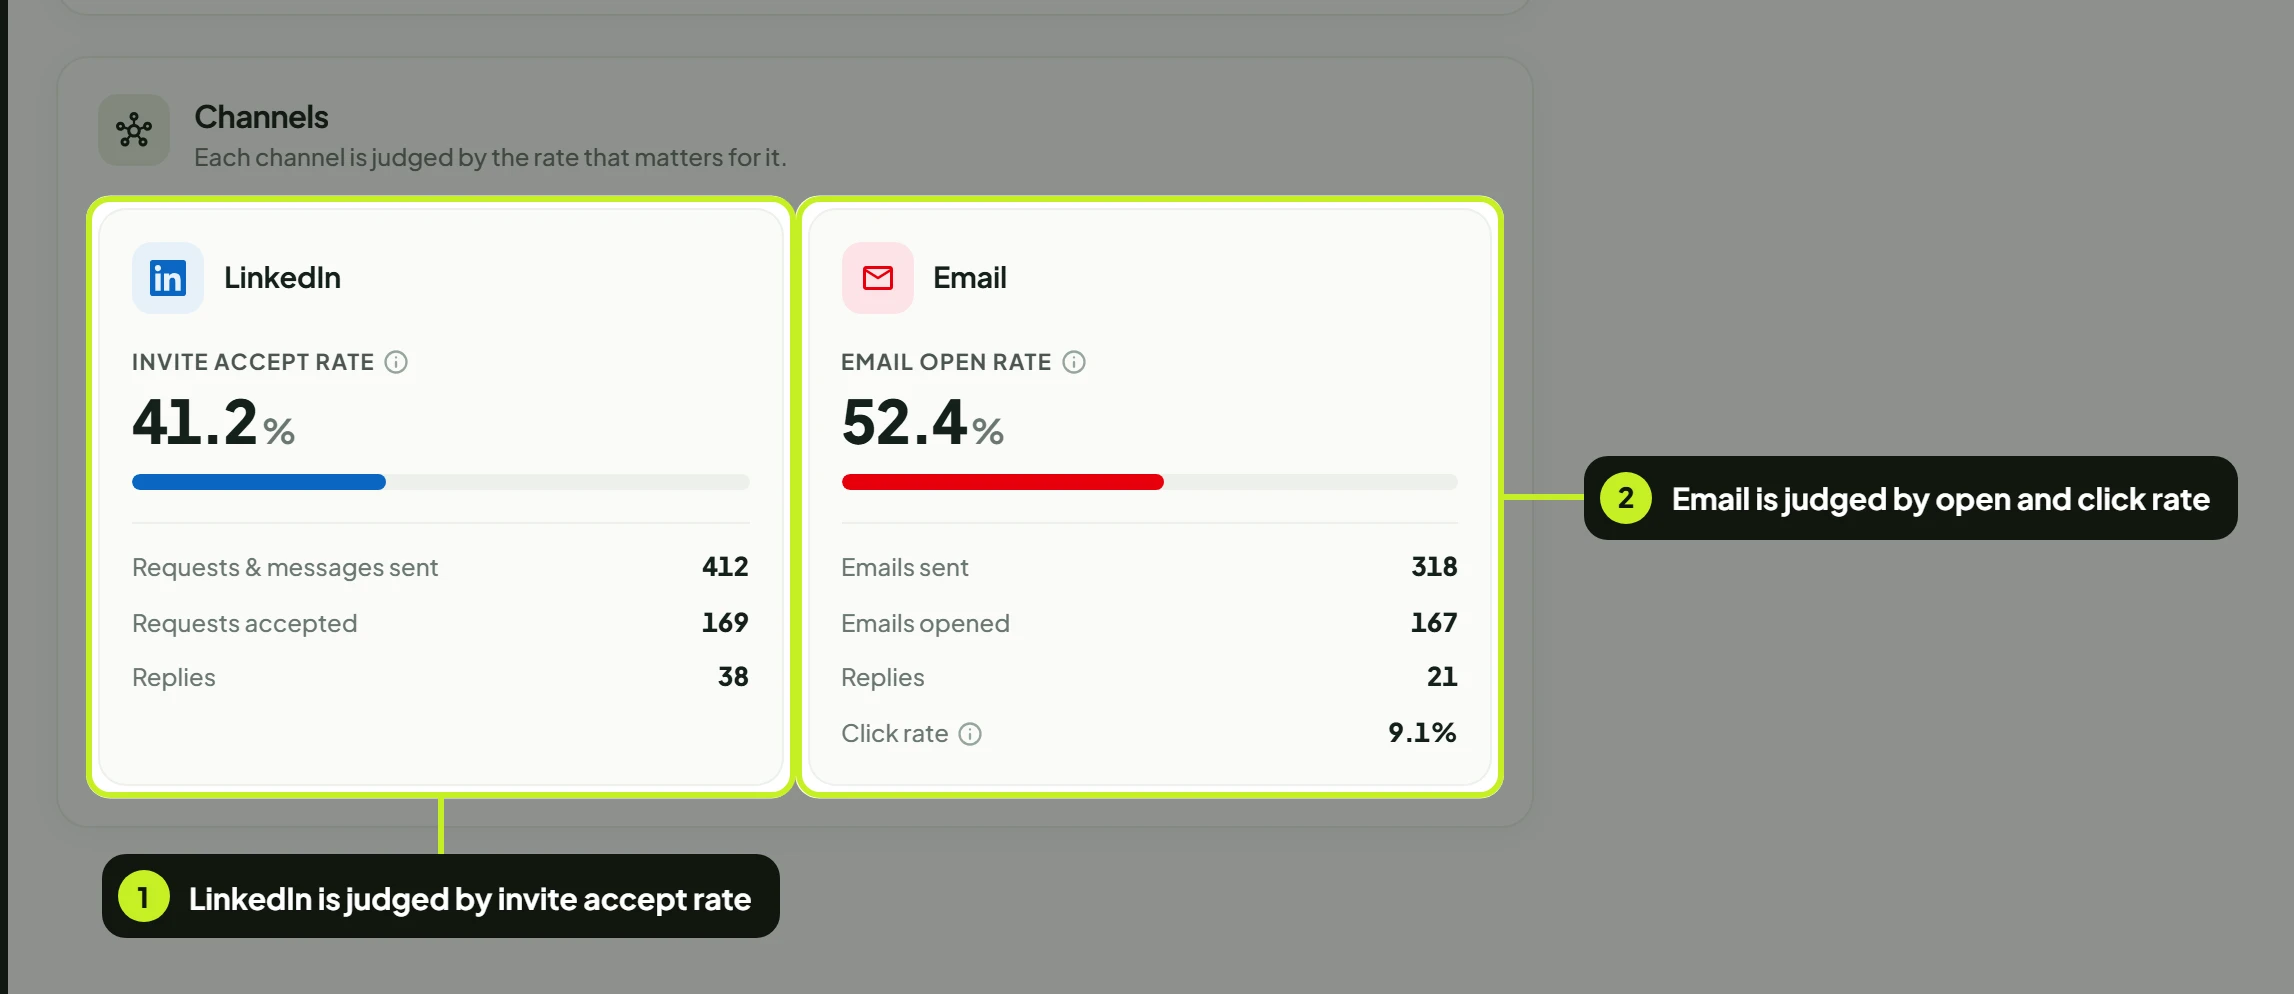
| Card | Headline rate | Counts underneath |
|---|---|---|
| Invite accept rate | Requests & messages sent, Requests accepted, Replies | |
| Email open rate | Emails sent, Emails opened, Replies, Click rate | |
| InMail | InMail reply rate | InMails sent, InMails opened, Replies |
The InMail card only appears in a period when InMails were sent.
Campaigns
Every campaign in the workspace, ranked by the result you choose.
- Choose what to rank by: Reply rate, Meetings or Outreach sent. The line under the title says how the list is ranked, for example Ranked by reply rate; ties go to the campaign that sent more.
- Use the arrows to page through the ranking, five campaigns at a time.
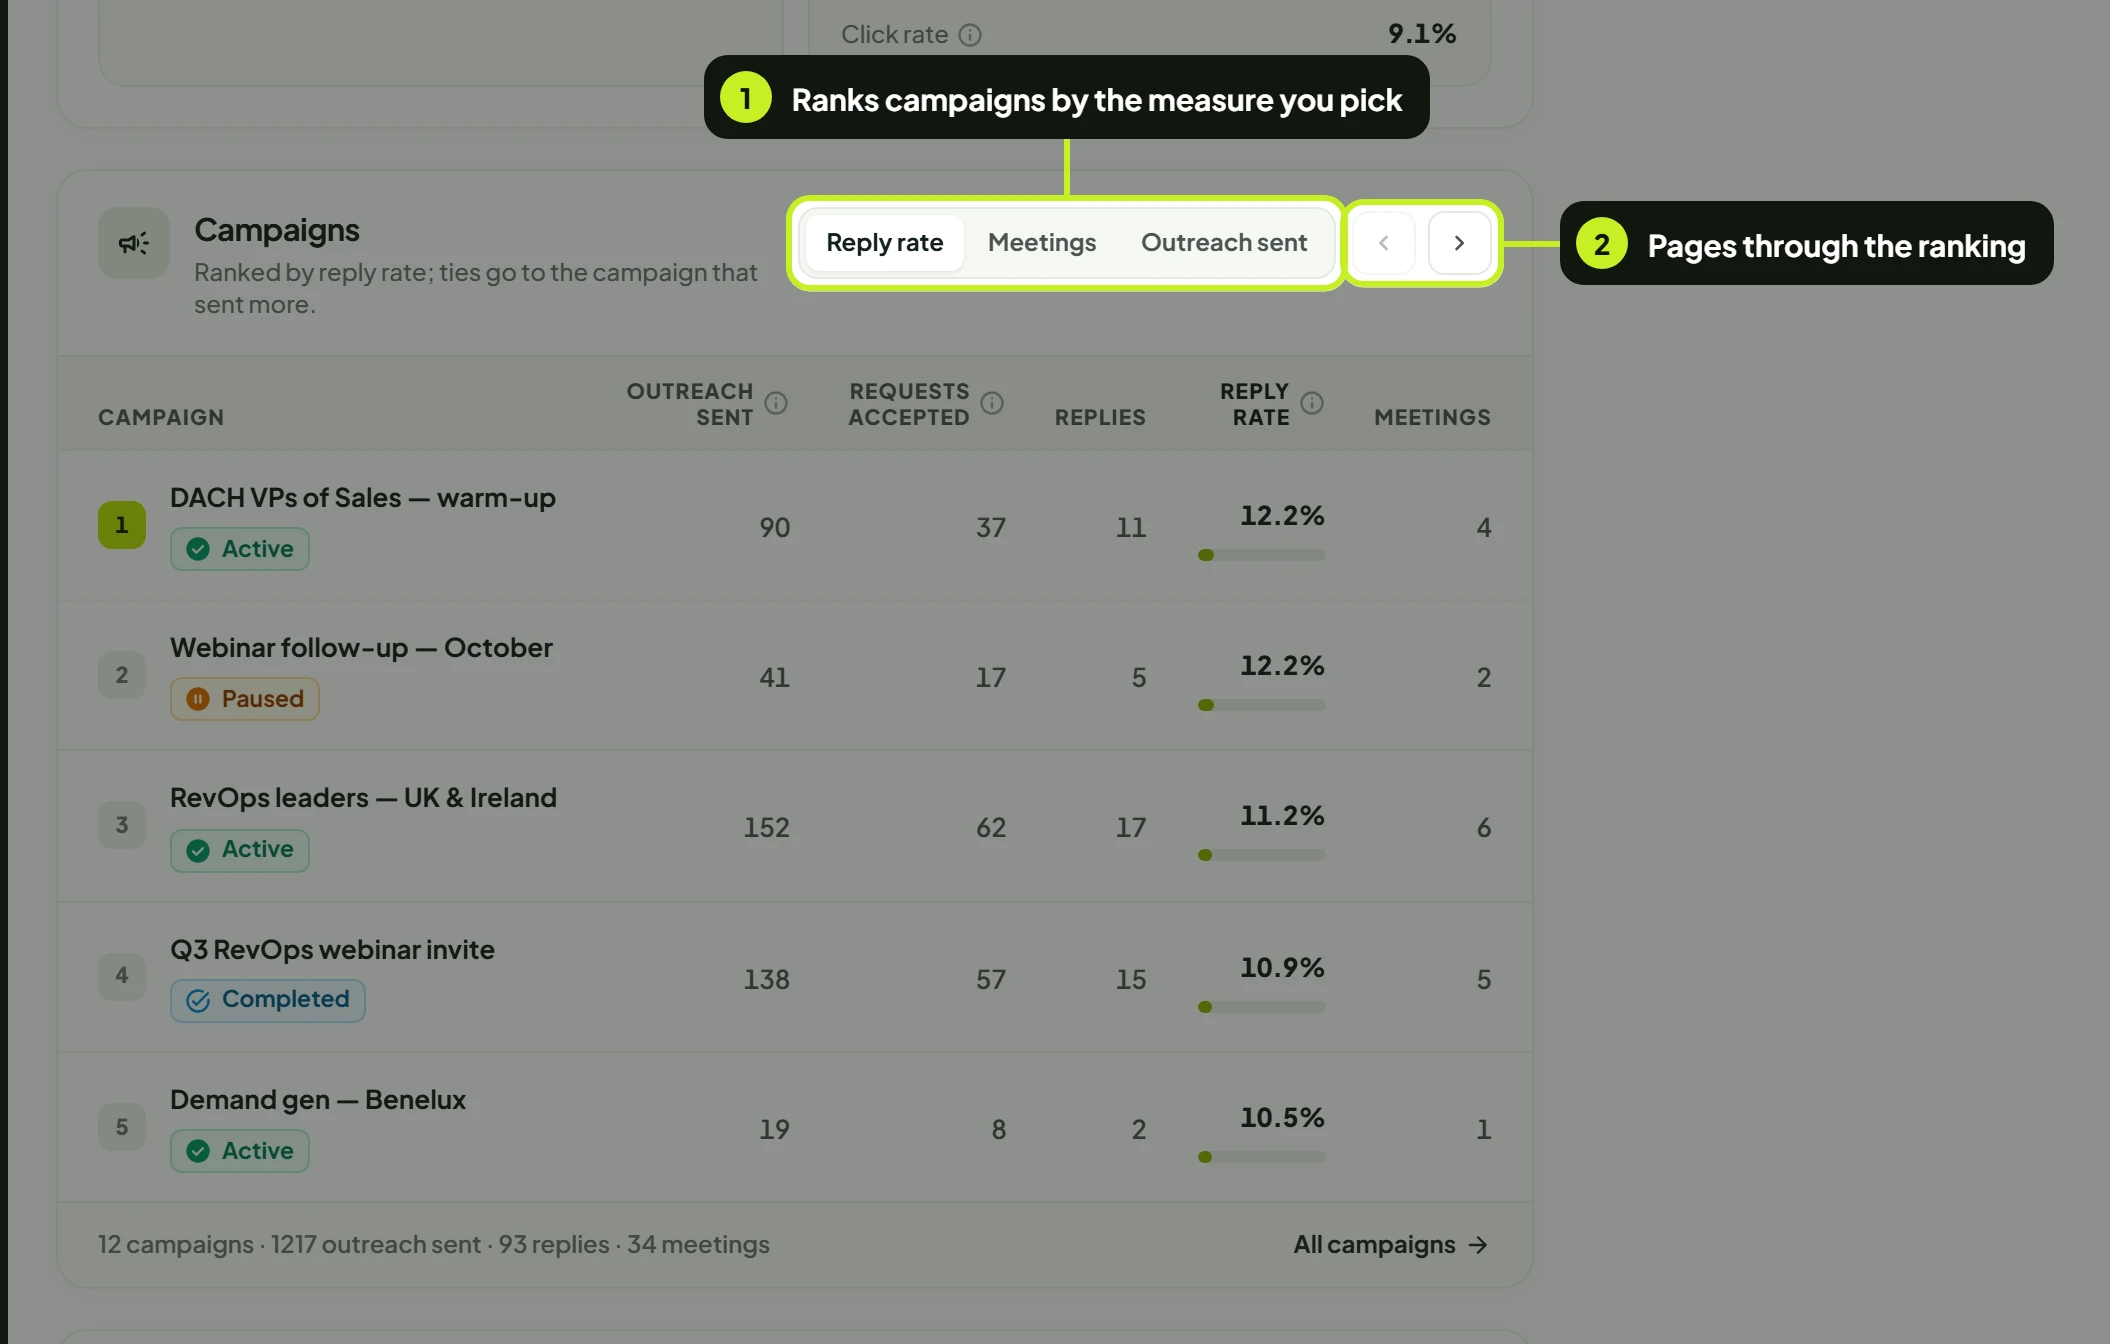
The ranking covers all your campaigns, not just the five on screen. Each row shows the campaign's status (for example Active or Paused), Outreach sent, Requests accepted, Replies, Reply rate and Meetings; the column you rank by also has a small bar. The line at the bottom adds up the period: campaigns, outreach sent, replies and meetings.
- Click a campaign's name to open it on the Campaigns page.
- Click All campaigns to open the Campaigns page.
Sending seats
Results grouped by the LinkedIn account or email inbox that did the sending.
- Check each seat's status under its name: Connected, or Disconnected (with a red dot) if it has stopped sending.
- Click Manage seats to open the Accounts page, where you reconnect or add seats.
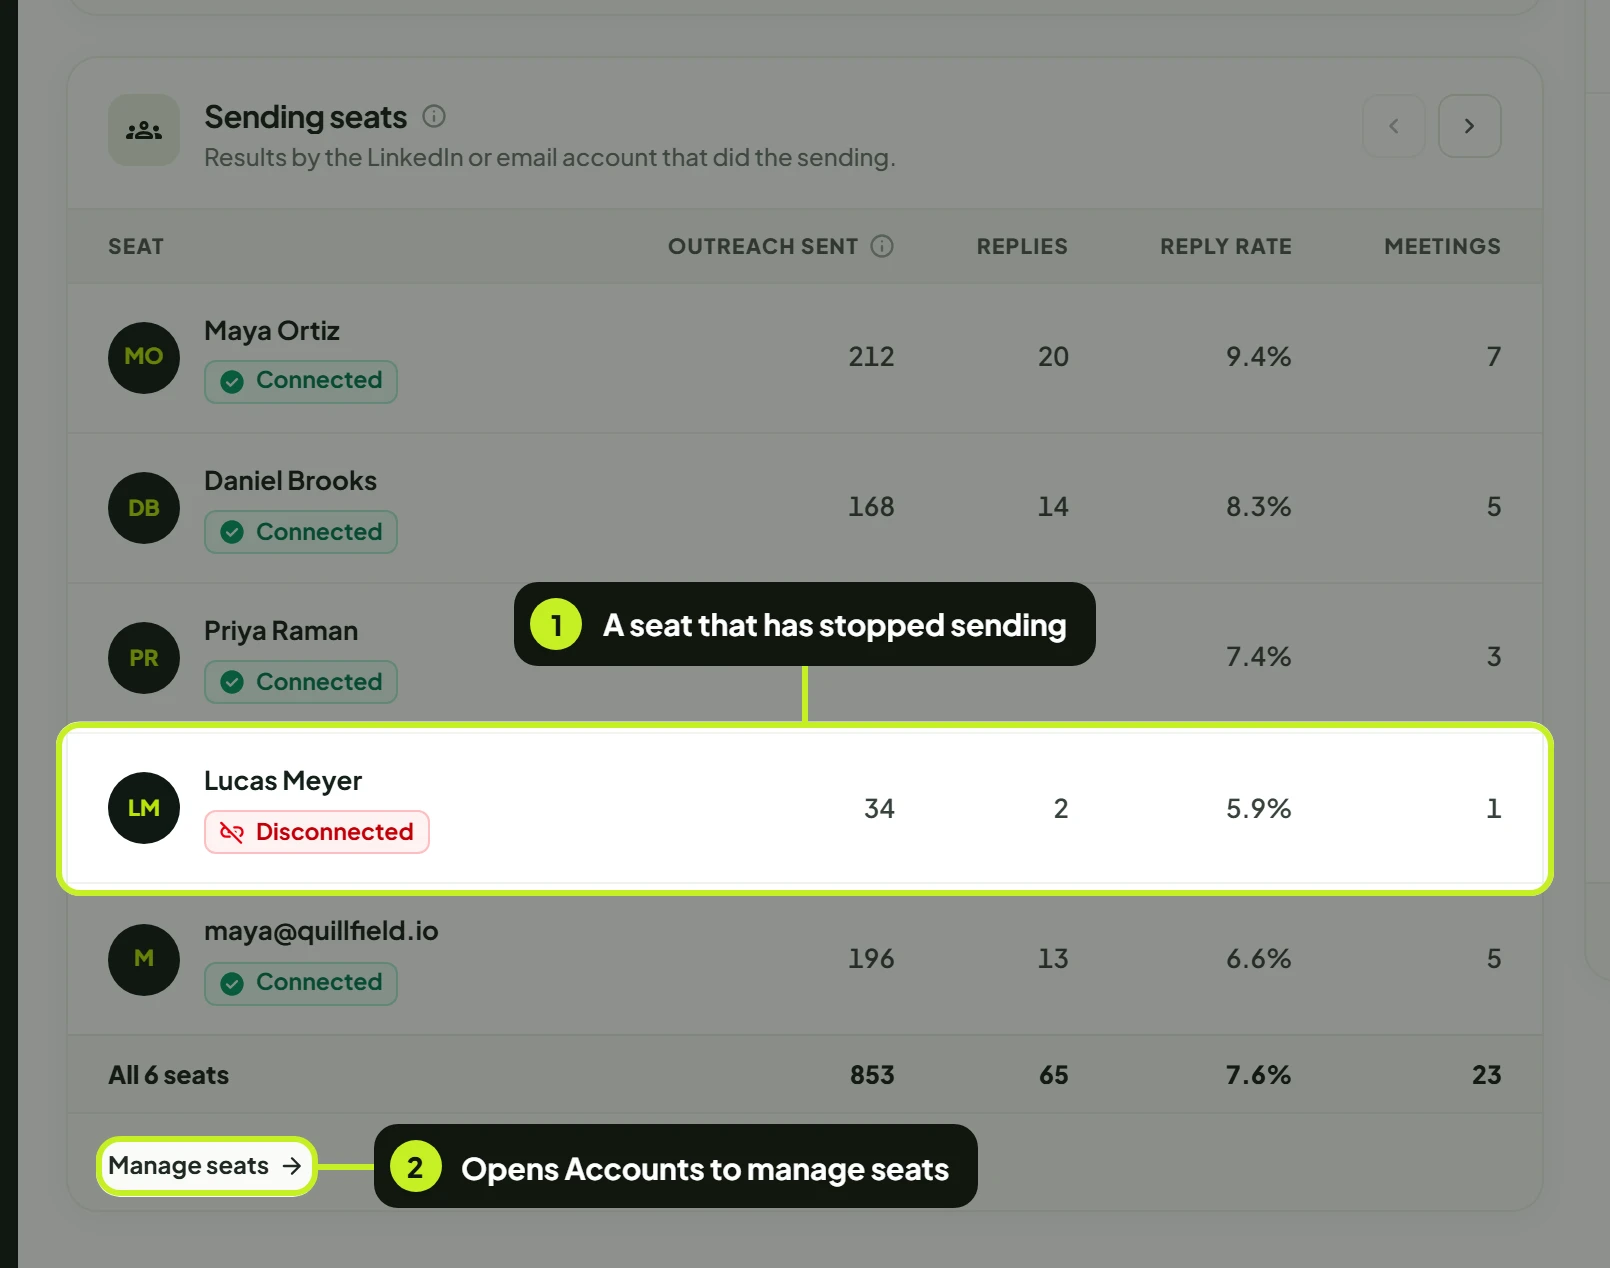
Each row shows Outreach sent, Replies, Reply rate and Meetings, and the bottom row totals all your seats. Click a seat's name to see the campaigns that send from it.
Results are grouped by seat rather than by team member, because every send records the account it went through. A seat you've since removed still shows the work it did, labelled Removed seat, so your totals stay complete.
Tip: A Disconnected seat sends nothing until it's reconnected, and it also appears at the top of Needs you now with a Reconnect button. See Manage seats and reconnect.
On a phone or small screen
The cards stack in one column. The right-hand column moves to the top, so Needs you now is the first card you see. The journey stages scroll sideways.
Common problems
| What you see | What it means | What to do |
|---|---|---|
| Nothing went out in this period. | No outreach was sent in the days you picked. | Pick a longer period, or check that a campaign is running and inside its sending window. |
| No campaign ran a step in this period. | No campaign ran any step, including visits and likes. | Check the campaign is Active on the Campaigns page. |
| No channel activity yet. | Nothing was sent on any channel in the period. | Pick a longer period, or launch a campaign. |
| No campaign has run in this window yet. | No campaign sent anything in the period. | Pick 30 days or All time. |
| No sending activity in this window. | None of your seats sent anything in the period. | Check Accounts for disconnected seats. |
| The Today strip shows numbers but the cards show none | The Today strip always shows today; the cards follow the period you picked. | Pick Today to compare like with like. |
| Positive replies or Meetings booked looks low | These count tags your campaigns applied, not tags added by hand. | Check the leads' tags; replies you tagged yourself show on Latest replies. |
| No change chips on the journey | All time has no earlier period to compare with. | Pick Today, 7 days, 30 days or Custom. |
| New campaign isn't in the header | Your role can't create campaigns. | Ask your workspace admin. |
Next: Act on what's waiting for you in Needs you now and activity.